Blog Archives
Simple Approach to (Without) SVM Algorithm (Create Hyperplane Base Regression Of Closest Pair)
Hi All Student, we apologize for the delay in posting “Sentiment Analysis Document Using Support Vector Machines (SVMs) With Linier & Polynomial Kernel Without Matlab ToolBox” . But it’s okey. 😀
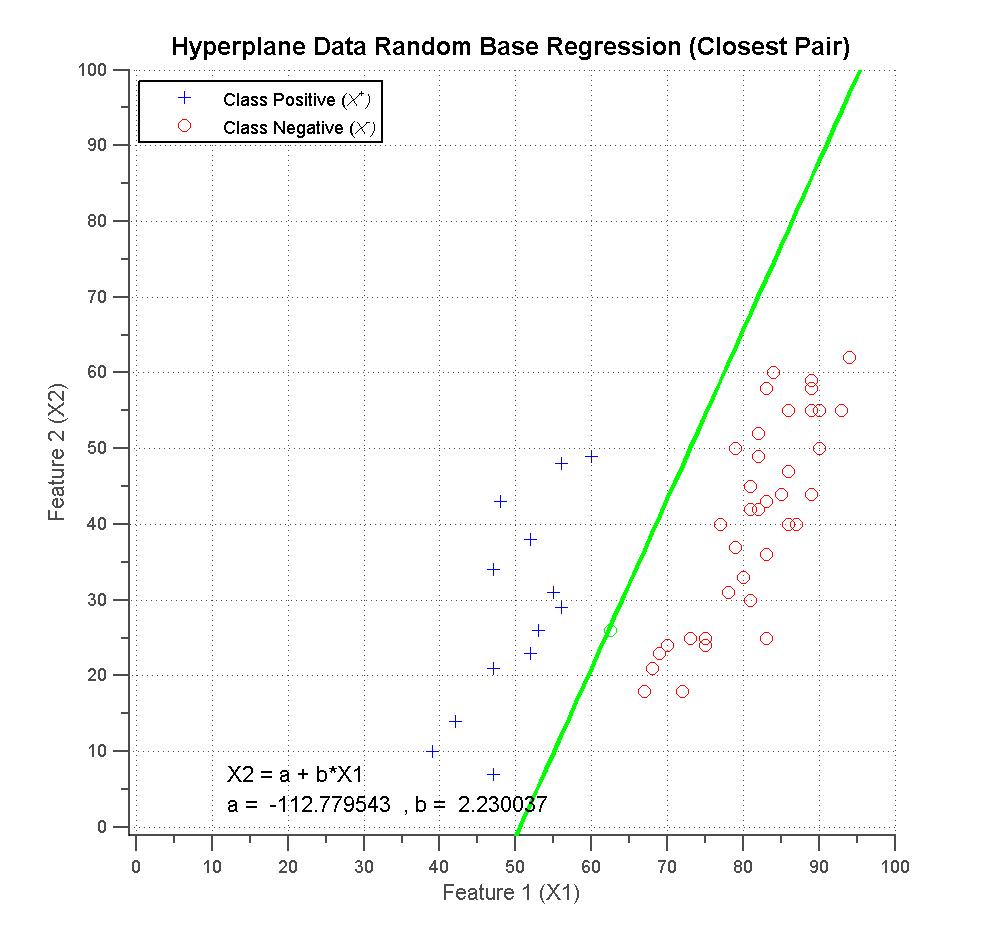
In this week we will provide an overview of a technique which it’s think is a very simple approach to be implemented in making comparisons with the results hyperplane formed of Support Vector Machine (SVM) on linear data to separate the two classes (binary classification), based Linear Regression method on nearest points (Closest Pair) is formed of two points between classes to take its midpoint. Obviously this method is very vulnerable to errors in the formation of the hyperplane line, because they do not have a concept of Support Vector, in the sense that all points are considered all result of midpoint or it’s just take few of midpoint.
This is the linear regression formula (y = a + b*x) :

Tracking animation base Closest Pair :

Hyperplane_Data_Random_Base_Regression_Closest_Pair
View results part 1 :

Hyperplane Data Random Base Regression (Closest Pair)_1
View results part 2 :

Hyperplane Data Random Base Regression (Closest Pair)_2
View results part 3 :

Hyperplane Data Random Base Regression (Closest Pair)_3
View results part 4 :
Hyperplane Data Random Base Regression (Closest Pair)_4
You can download This Matlab Code All About “Simple_Approach_Hyperplane_Of_SVM_Base_Regression_Closest_Pair” at (Simple_Approach_Hyperplane_Of_SVM_Base_Regression_Closest_Pair.zip). Note : “After Download it, To Extract File (Simple_Approach_Hyperplane_Of_SVM_Base_Regression_Closest_Pair.zip), You must Rename Extension *.doc to *.zip” ![]()
To Running the program, double click Simple_Approach_Hyperplane_Of_SVM_Base_Regression_Closest_Pair.m file. Enjoy with matlab code, especially for your research.
Any Suggestions, Question and Other, Send to My Email : matlabfreecode@gmail.com
(CMIIW & PMIIW).
Normalization Data Statistics Base on Z-Index and Interval
The inspiration to write about the normalization of this data is very interested in the desire to post often I read a paper of which relate to it, because it is in many ways such as data mining, image processing, computer vision. So this normalization method is often used and is not only popular in the field statistics. And can be regarded as the earliest step prior to the next process in a study of research. Actually, the normalization of the data (statistical data) in the image or the matrix is very much at all its variants, there is a normalization with specific rules adapted to the shape of the data and output the desired normalization, but normalization is commonly used in the form of Z-Index and Interval, where the Z-Index is based on the normal distribution N (0.1) while the interval based on a specific number range so that there is a lower boundary and upper boundary. 😀
Various kinds of data normalization methods and examples:
1. Z-Index
With mean = 0 and var = 1, example :
Data Input : 35 50 79 66 51 66 4 21 29 81
Data Output Result Normalization : -0.5153 0.0703 1.2024 0.6949 0.1093 0.6949 -1.7255 -1.0618 -0.7495 1.2805
2. Interval
Suppose with lower_boundary = 0.01 and upper_boundary = 0.97, example :
Data Input : 35 50 79 66 51 66 4 21 29 81
Data Output Result Normalization 0.3965 0.5835 0.9451 0.7830 0.5960 0.7830 0.0100 0.2219 0.3217 0.9700
Excess of Normalization :
+ Ease of data processing.
+ Simplifying complex data processing and heterogeneous.
+ Ease in analyzing the data.
Shortage of Normalization :
– Some information will be missing data.
– The lack of data denormalisasi process (the inverse of the normalization process data) which can restore the data as the original data. The possibility of the normalization & denormalisasi process can be used as a new contribution to science in the field of information technology and statistics. 😀
********************* Normalization_Data_With_Z_Index_Eng.m *********************

% =================================================================== %

%           Normalization Data Statistics From Random Sample          %

%                           (base on Z-Index)                         %

%                   With value of Mean = 0 and Var = 1                %

% =================================================================== %

function [] = Normalization_Data_With_Z_Index_Eng()

clear memory;

close all;

clear all;

clc;

tic
% Create a random sample of data
DataInput=rand(10,1);
DataInput=ceil(DataInput*100)
Rand_Sample=DataInput;
% Count Mean value from Rand_Sample
mean_Rand_Sample=mean(Rand_Sample(:));
% Count value of standard deviation from Rand_Sample
std_Rand_Sample=std(double(Rand_Sample(:)));
% Count value Result of Normalization process from Rand_Sample
normalize_Rand_Sample_zIndex=(Rand_Sample-mean_Rand_Sample)./std_Rand_Sample;
DataOutput=normalize_Rand_Sample_zIndex
toc
********************* Normalization_Data_With_Z_Index_Eng.m *********************
********************* Normalization_Data_With_Interval_Eng.m *********************
% =================================================================== %

%           Normalization Data Statistics From Random Sample          %

%                       (based on the interval)                       %

%     For example with lower_boundary = 0 and upper_boundary = 1      %

%          Or lower_boundary = 0.01; upper_boundary =0.97;            %

% =================================================================== %

function [] = Normalization_Data_With_Interval_Eng()

clear memory;

close all;

clear all;

clc;

tic
% Create a random sample of data
DataInput=rand(10,1);
DataInput=ceil(DataInput*100)
Rand_Sample=DataInput;
% Set lower_boundary and upper_boundary, such as you want
lower_boundary = -1; upper_boundary =1;
% Count Max. value from Rand_Sample
max_Rand_Sample=max(max(Rand_Sample));
% Count Min. value from Rand_Sample
min_Rand_Sample=min(min(Rand_Sample));
% Count value Result of Normalization process from Rand_Sample
normalize_Rand_Sample_minMax=(((Rand_Sample-min_Rand_Sample)./(max_Rand_Sample-min_Rand_Sample))*(upper_boundary-lower_boundary))+lower_boundary;
DataOutput=normalize_Rand_Sample_minMax
toc
********************* Normalization_Data_With_Interval_Eng.m *********************
Any Suggestions, Question and Other, Send to My Email : matlabfreecode@gmail.com
(CMIIW & PMIIW).


